Comparetofirst_staggered.pl example

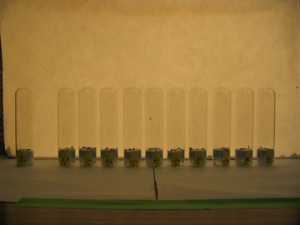
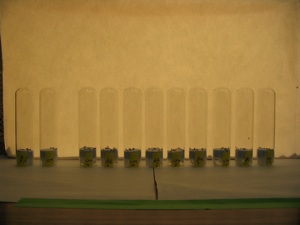
Figure 1.
The files on the left contain flies that are being sedated with little cups of solvent located below them. They have been started sequentially. Each tube is started 1 minute after the last one. Once they are sedated, the cup of solvent is removed and the flies in the tube start to wake up.
The intent of this program is to measure the recovery time. The word “staggered” in the name of the program means that it uses as a “blank” the t=0 timepoint for tube 1, the t=1 timepoint for tube 2, the t=2 timepoint for tube 3, etc.
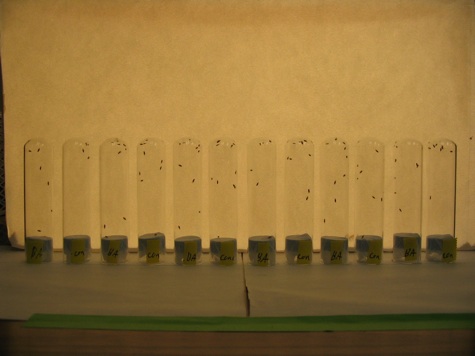
Figure 2.
Figure 2 is one of the last photos and shows that most of the flies have recovered.
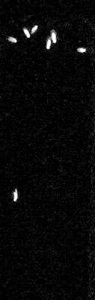
Figure 3.
This is an example of the product of the comparetofirst_staggered.pl program. It is the last tube on the far left in figure 3. All of these output files are named in this format: cell_xx.yyyyy.jpg.
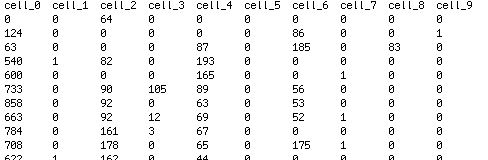
Figure 4.
If you run the quantify.pl program you will get a tab delimited table like this. For this data I think that that cell_0 through cell_4 are treated and cell_5 through cell_9 are treated (but don’t quote me).
You can import it into to Neooffice or Excel to produce a plot like the one in Fig.5.
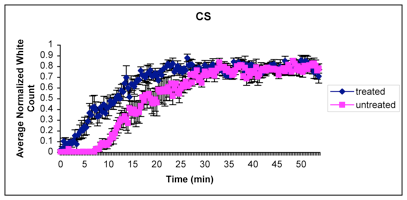
Figure 5.